
?I waste so much time switching between different apps to check my reports and updates.
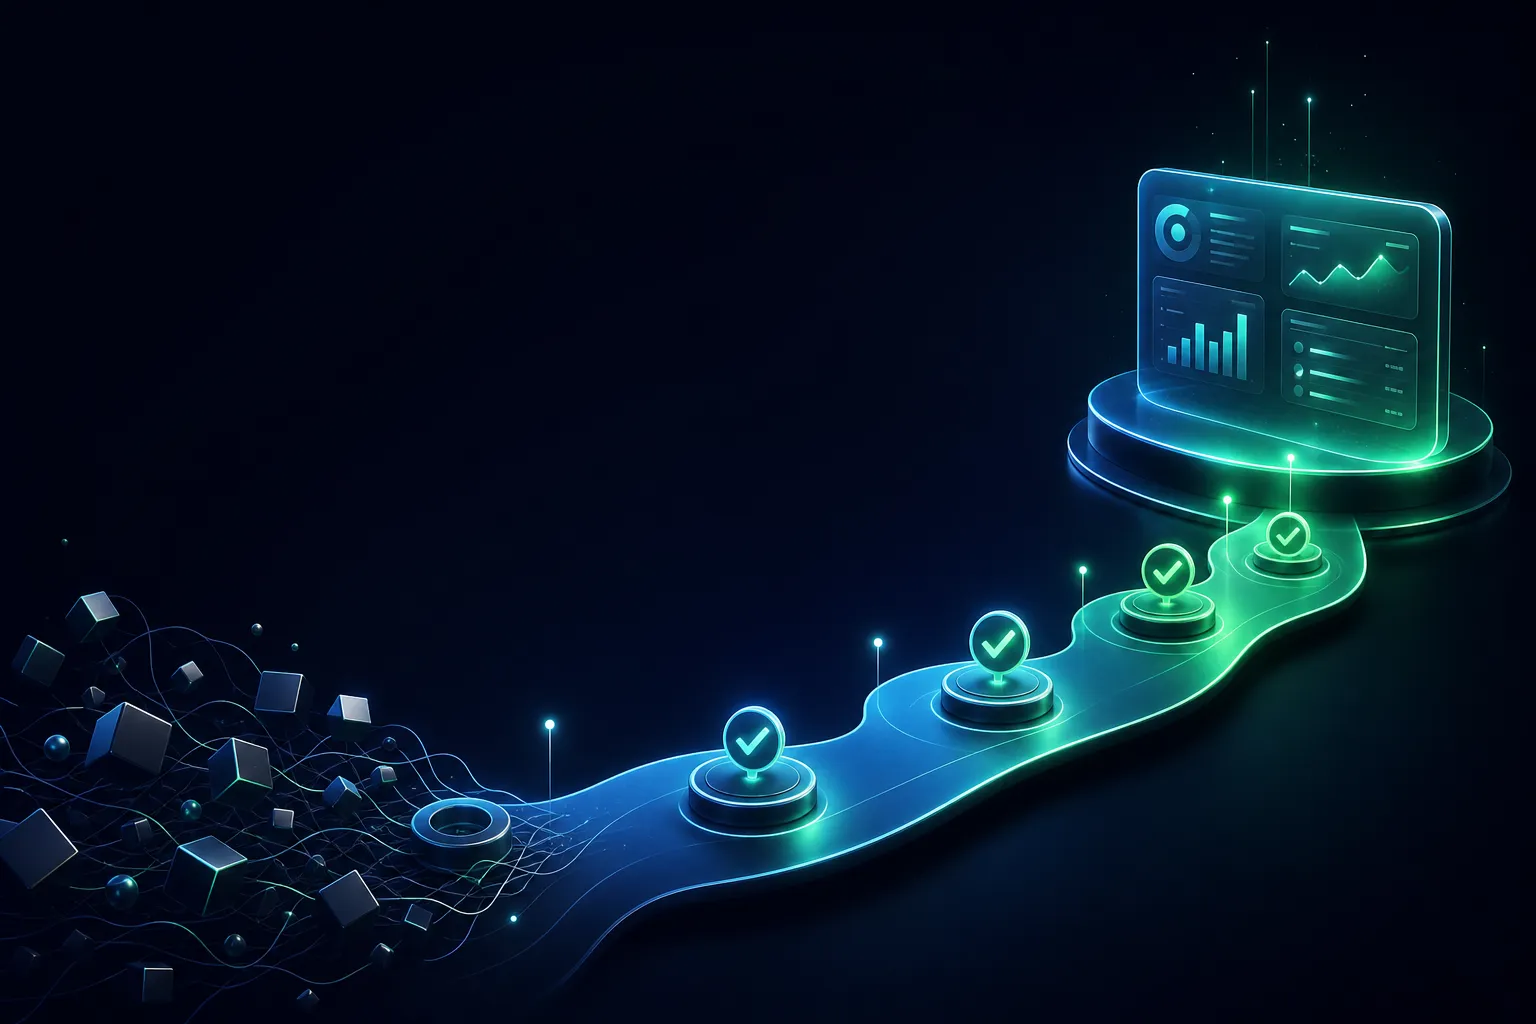
✓One Dashboard for Every Tool brings all your tools and reports together in a single view, eliminating the need to switch between apps and saving you time.
Solutions
AWEBCs builds a single dashboard that connects the tools your team already uses, so you stop switching between tabs to find answers. Tell us which systems you run and we will send a written quote for bringing them into one view.
The problem you are facing
?I waste so much time switching between different apps to check my reports and updates.
✓One Dashboard for Every Tool brings all your tools and reports together in a single view, eliminating the need to switch between apps and saving you time.
?I can never find the latest version of a report because it's buried in one of many tools.
✓With One Dashboard for Every Tool, all your reports are centralized and easily accessible, so you always have the latest information at your fingertips.
?My team struggles to stay aligned because everyone looks at different data sources.
✓One Dashboard for Every Tool provides a unified view of data from all your tools, ensuring everyone on your team sees the same information and stays aligned.
How it works
Identify the tools and reports you use regularly.
Connect these tools to One Dashboard for Every Tool.
Customize your dashboard to display the information that matters most.
Access your unified dashboard anytime, anywhere.
One Dashboard for Every Tool is a single web page that pulls data from the software your team already uses—such as project trackers, accounting packages, email platforms, and custom spreadsheets—and displays it together. Instead of logging into each tool separately, you see key numbers and reports side by side. It works by connecting to each tool through its API or a secure data feed, fetching updates on a schedule you set, and presenting the results in clear, consistent widgets. This approach is gaining traction as one dashboard for every tool india teams adopt to reduce tool sprawl.
To set it up, you first list every tool that holds data you check regularly. For each, note what you need to see—sales totals, open tickets, campaign performance, or inventory levels. Then confirm whether the tool offers an API or export option. The dashboard connects using read-only access, so your source data stays untouched. You choose how often each connection refreshes: near real-time for critical metrics, daily for reports. Finally, you arrange widgets on a shared layout and invite team members to view it.
Check that each connection returns the fields you expect and that numbers match the source tool when you first connect. Verify refresh timing against your work rhythm—if you need morning updates, schedule syncs before start of day. Watch for tools that limit API calls, as frequent syncing may hit those limits. When a connection fails repeatedly or data looks inconsistent, ask for help; troubleshooting authentication or field mapping is faster with support than trial and error.
The dashboard does not replace your tools; it sits on top of them. You still perform tasks in the original software, but you monitor and compare results in one place. This separation keeps your workflows intact while giving managers a unified view. For teams comparing options, understanding one dashboard for every tool price india involves factoring in setup effort, number of connectors, and ongoing maintenance—not just a license fee.
When evaluating, test with a small set of tools first. Confirm that the dashboard can handle your data volume and that widgets load quickly. Check whether custom calculations are possible if you need derived metrics. Review how access is managed: can you restrict sensitive widgets to certain roles? If your tools include legacy or industry-specific software without APIs, discuss workarounds such as scheduled exports. Ask for help early if connectivity is unclear.
Most teams juggle a dozen or more logins daily. Project updates live in one tool, financial reports in another, and customer conversations in a third. Staff waste time switching tabs, re-entering credentials, and manually copying numbers into spreadsheets. Reports arrive in different formats and time zones, making comparisons difficult. Decisions get delayed because no one has a complete picture. One Dashboard for Every Tool solves this by consolidating views, so you check one page instead of many, and everyone works from the same numbers.
The steps to address this start with mapping your current tools and the reports you generate from each. Identify overlaps—two tools tracking similar metrics—and decide which is authoritative. Then define the key questions your team asks weekly, such as "What are this week's sales?" or "How many support tickets are open?" For each question, note the source tool and the field that answers it. This map becomes the blueprint for your dashboard and reduces redundant logins.
Check for version conflicts: if two tools report different totals for the same metric, investigate why before displaying both. Verify that time zones and date ranges align across widgets. Watch for manual steps that remain—such as exporting a CSV—and see if they can be automated. When discrepancies persist or a tool lacks an API, ask for help to find a reliable integration method or a temporary workaround.
Beyond time savings, consolidation improves accuracy. When data is pulled automatically, you reduce transcription errors and stale figures. Managers see trends across departments without requesting separate reports. Staff spend less time preparing updates and more time acting on insights. For organisations in multiple locations, a shared dashboard becomes a single source of truth, especially when teams are distributed.
The cost of scattered tools is not just software subscriptions but the hidden labour of reconciliation. Calculating one dashboard for every tool cost india should include staff hours saved and errors avoided, not just licensing. When building a business case, document current time spent on manual reporting and login management. This baseline helps you measure improvement after the dashboard is live and justify the investment to stakeholders.
This dashboard suits small and mid-sized teams that use several cloud tools but lack a unified view. It is especially relevant for organisations in Uttarakhand and the surrounding industrial belt, where businesses often run operations, sales, and support on separate platforms. Manufacturing units tracking production and inventory, service firms managing projects and billing, and educational institutes coordinating admissions and fees can all benefit. If your team spends time each week compiling reports from multiple sources, this solution is designed for you.
Identify the roles that will use the dashboard: owners and managers needing summary views, finance staff reconciling numbers, and operations teams monitoring daily activity. For each role, list the decisions they make and the data required. This helps prioritise which tools to connect first. Start with the two or three tools that cause the most manual effort. Then expand to secondary tools once the initial setup is stable and users are comfortable.
Check that each role has appropriate access—view-only for most, edit rights for administrators. Verify that the dashboard works on the devices your team uses, including mobiles for staff on the shop floor or in the field. Consider language and time-zone settings if you work with partners outside India. When user roles are complex or external partners need access, ask for help to design permissions that protect sensitive data.
While based in Uttarakhand, the solution is not limited by geography. Teams across India and abroad can use the same dashboard, provided they have internet access and credentials. This makes it suitable for companies with branch offices or remote staff. The key requirement is that your tools are cloud-based or can export data securely. If you rely on on-premise software, discuss connectivity options before committing.
For teams evaluating fit, consider the number of tools and users. A dashboard that serves five people may need different features than one for fifty. Also assess your tolerance for initial setup effort—connecting tools takes time, but ongoing maintenance is light. If you are unsure whether your toolset is supported, ask for a compatibility check. This avoids surprises and ensures the dashboard delivers value from day one.
The core of the dashboard is its connectors—pre-built links to popular tools like accounting software, project management platforms, and email services. Each connector maps fields from the source tool to dashboard widgets. You can also use generic connectors for custom databases or spreadsheets. Connectors run on a schedule, pulling only the data you need. This modular design means you add tools one at a time, keeping the dashboard fast and focused on what matters to your team.
Widgets are the building blocks of the display. Choose from number tiles, bar and line charts, tables, and progress bars. Each widget is configured to show a specific metric from a connected tool. You can arrange widgets into tabs or sections—for example, a sales tab and a support tab. Filters let you narrow data by date range, team, or region. Setting up a widget involves selecting the source, choosing the metric, and picking a visualisation that makes the trend clear.
Check that widgets refresh correctly and that filters apply as expected. Verify that calculations like totals and averages match the source tool. Watch for time-zone differences in date filters, especially if you work across regions. Test how the dashboard behaves when a source tool is temporarily unavailable—does it show the last known value or an error? When widgets show unexpected results, ask for help to trace the data path.
Reports can be scheduled to arrive by email, so you do not need to log in to check. You can also export any widget's data to a spreadsheet for further analysis. Alerts can notify you when a metric crosses a threshold you set, such as low stock or a drop in sales. These features turn the dashboard from a passive display into an active monitoring tool, helping you respond to issues before they escalate.
Security is built into every layer. Connections use encrypted channels and read-only access where possible. User authentication can be integrated with your existing directory, and activity logs record who viewed or changed settings. For organisations concerned about data residency, discuss hosting options. When planning your setup, consider which features are essential now and which can wait. This phased approach keeps the project manageable and aligns with your budget.
Setup begins with a discovery session where we list your tools, the data you need, and the people who will use the dashboard. We then prioritise connections based on impact and ease. For each tool, we confirm the integration method—API, webhook, or scheduled export. You provide read-only credentials or authorise access through the tool's own permission screen. We document the data mapping so you know exactly which fields feed each widget. This planning phase prevents rework later.
Next, we build the connections and configure widgets in a staging environment. You review the draft dashboard and request changes to layout, metrics, or filters. We test each connection for accuracy and reliability, comparing dashboard figures with source reports. Once approved, we move the dashboard to production and set the refresh schedule. Finally, we train your team on viewing, filtering, and sharing the dashboard, and provide a simple guide for common tasks.
Check that all connections are active and that data appears within the expected time after setup. Verify user access: can each person see what they need without seeing what they should not? Test alerts and scheduled reports by triggering a sample. Monitor the first week for failed syncs or slow loads. If a connection drops or a widget shows an error, ask for help—most issues are resolved quickly by re-authenticating or adjusting a setting.
Ongoing maintenance is minimal. We recommend a monthly review to check for tool updates that might affect connectors and to adjust widgets as your business changes. If you add a new tool, we can connect it and add relevant widgets. You can also request new reports or alerts as needs evolve. This iterative approach ensures the dashboard grows with your team rather than becoming outdated.
For budgeting, the total effort depends on the number of tools and the complexity of data mapping. When requesting a quote, ask for a breakdown of setup and any recurring fees. Understanding one dashboard for every tool cost india helps you plan, but also consider the internal time your team will spend on reviews and training. A clear scope and a phased rollout keep costs predictable and deliver value early.
Dashboard pricing is built from scope, not from a flat rate. The first thing we assess is how many sources you want connected: your accounting package, project tracker, helpdesk, spreadsheets, or a clinic system. Each connector takes planning, mapping, and testing, so a dashboard pulling from two tools costs less to build than one reconciling eight. We document every source before quoting so you can see exactly what drives the figure.
The second factor is data shape. Tools that expose clean APIs or scheduled exports are quicker to integrate, while systems relying on manual downloads or awkward file formats need extra transformation work. We review sample data from each source and flag where cleaning rules are required. If your reports mix currencies, time zones, or inconsistent naming, those rules become part of the estimate rather than a surprise later.
Report complexity matters too. A simple summary of totals is straightforward; calculated metrics, period comparisons, role-based views, and drill-downs take more design and validation effort. We ask which questions the dashboard must answer and which decisions it supports, then price the reports that genuinely serve those decisions. Requesting every possible chart inflates cost without improving usefulness, so we help you prioritise.
Ongoing cost depends on refresh frequency and hosting. Daily refreshes are lighter than near-real-time feeds, and the number of users affects licensing and infrastructure. For buyers comparing options across one dashboard for every tool company india, we explain these levers plainly so the quote reflects your actual usage pattern. Maintenance, connector updates, and small report changes are discussed as a separate arrangement.
Before you commit, confirm what the quote includes: connector builds, data mapping, user training, and a defined revision round. Ask how changes are priced after launch and what notice is needed to add a source. If you are unsure whether a connector is feasible, raise it during scoping rather than after signing. Clear assumptions in writing protect both sides and keep the project predictable.
Help starts at the point of handover rather than once a fault appears. When your dashboard goes live, we walk your team through logging in, reading each report, and understanding refresh timing. You receive written notes covering the layout, data sources, and known limitations, so new staff can be onboarded without calling us for basics. This initial enablement is part of the delivery, and we schedule it at a time your users can attend.
Day-to-day support covers questions about figures that look wrong, access requests, and small adjustments to filters or labels. We agree a channel and response expectation in advance, so your team knows where to raise an issue and what information to include, such as the report name, the date range, and a screenshot. Triage is faster when the request arrives with those details rather than a general message.
We also monitor connector health. When a source tool changes its API or export format, dashboards can silently show stale or partial data. Our support process includes checks after known provider updates and a periodic review of refresh logs. If you notice a figure that has stopped moving, report it promptly; a refresh failure is usually quicker to fix than a mapping error discovered weeks later.
For organisations running one dashboard for every tool for business india, support often extends to governance questions: who approves new users, how reports are retired, and how changes are requested. We help you define a short change process so requests do not bypass review. Training refreshers are available when team composition changes, and we recommend scheduling them before busy reporting periods rather than during them.
Escalate early when an issue affects decisions, such as month-end reporting or a compliance deadline. Include the business impact in your message so it can be prioritised sensibly. Ask for a written summary after any significant fix, and keep your contact list current. Support works best when expectations are documented at the start and reviewed annually as your toolset and team evolve.
A consolidated dashboard concentrates sensitive information, so access control deserves deliberate design. We start by listing every user group and what each should see: finance totals, operational detail, or a narrow view of their own region. Roles are then mapped to reports and data rows, not just to pages. A user who should see only their branch should not receive a dashboard where filtering is optional, because optional filters are easily bypassed.
Authentication is the next layer. Where possible we connect to your existing identity provider so accounts are created and removed in one place. Multi-factor authentication is recommended for anyone with administrative rights. Shared logins undermine accountability and make it difficult to investigate incidents, so we advise named accounts even for small teams. When someone leaves, their access should be revoked through the same process that disables their email.
Data in transit and at rest should be encrypted, and credentials for source systems stored securely rather than embedded in spreadsheets or shared documents. We review how each connector authenticates and prefer read-only access where the dashboard only needs to display information. Ask your providers whether they support scoped tokens, and rotate keys on a schedule. These steps reduce the damage if a credential is exposed.
For clinic management software india deployments, access rules often need to reflect clinical roles and patient confidentiality. Aggregated operational reports can be separated from patient-level detail, with the latter restricted to authorised staff. We discuss retention, logging, and who may export data before building anything. Export rights are a common gap: a user blocked from a screen may still be able to download its underlying data if permissions are not aligned.
Review access quarterly and after any team change. Keep a record of who approved each role, and test that leavers lose access promptly. Ask for help when you introduce a new user group or a new data source, because both can quietly widen exposure. Security is a continuing practice, and small, regular checks are more effective than a single review at launch.
A dashboard displays and summarises; it does not replace the systems it reads from. If an invoice is entered incorrectly in your accounting tool, the dashboard will show the incorrect figure accurately. Corrections belong in the source system, and we build the dashboard to reflect what is there rather than to override it. Understanding this boundary prevents wasted effort trying to fix data quality at the reporting layer.
It also does not clean every inconsistency automatically. Where source tools use different customer names, product codes, or date conventions, mapping rules are needed, and those rules cover the cases we anticipate. New patterns appear over time, especially when staff add records freely. Plan a periodic review of unmatched or unmapped items, and treat the dashboard as a prompt to fix source data rather than a permanent patch.
Real-time behaviour has limits. Many tools permit only scheduled exports, so refreshes happen at intervals rather than continuously. We state the refresh cadence for each source in the documentation. If a decision depends on the last few minutes of activity, check the source system directly. Expecting instant updates from a tool that syncs hourly leads to mistrust of figures that are, in fact, behaving as designed.
The dashboard is not an archive or a backup. It should not be the only place a record exists, and it does not guarantee retention beyond what source systems keep. Nor does it replace statutory reporting or professional advice. For regulated areas, including clinical settings using clinic management software india, confirm with your compliance advisers which records must be retained and where. We can surface information, but we do not certify its regulatory sufficiency.
Finally, a dashboard does not make decisions. It informs them. Reports are only as useful as the questions they answer, and those questions change. When a report no longer guides a decision, retire it. When a new source is added, revisit the layout. Ask for help when scope creeps beyond what was agreed, so effort stays focused on reports your team actually uses.
Standalone tools each hold a piece of the picture, and staff often bridge the gaps by hand. Someone exports a spreadsheet, pastes figures into a template, and emails it around. That routine works until the person is on leave or the template is edited. A consolidated dashboard replaces repeated manual assembly with a scheduled refresh, so the same figures reach everyone from one place and the version in circulation is the current one.
Manual reports also consume time that could go into analysis. Copying numbers introduces transcription errors, and reconciling two exports by eye is slow and hard to audit. With a dashboard, the mapping rules are written once and applied consistently. When a figure looks unexpected, you can trace it back to the source rather than guessing which spreadsheet version was used. The saving is not just speed but confidence in the numbers.
Standalone tools remain the right place to do detailed work: entering transactions, managing appointments, or handling tickets. The dashboard complements them by bringing selected measures together for oversight. We usually recommend keeping source systems as the record of truth and treating the dashboard as a read-only layer. This avoids duplicating data entry and keeps responsibilities clear for each team.
Consolidation also improves consistency across departments. When finance, operations, and service teams read the same definitions, meetings spend less time disputing figures and more time deciding what to do. We document metric definitions alongside the dashboard so the meaning of each number is agreed. For organisations evaluating one dashboard for every tool company india, this shared definition is often the strongest argument for consolidating rather than adding another report.
Migration does not have to be all at once. Many teams start with the two or three reports that cause the most manual effort, run them alongside existing routines for a period, and retire the manual versions once trust is established. Ask for help deciding the sequence if priorities conflict. A staged approach keeps disruption low and gives your team time to adapt before the old process is switched off.
The most frequent mistake is treating consolidation as a copy-and-paste exercise. Teams pull every report from every tool onto one screen without deciding what decisions the dashboard should support. Before you connect anything, list the five questions your team asks each week, then map each tool to those questions. If a report does not answer one of them, leave it out for now. A dashboard that answers real questions gets used; one that simply mirrors every system becomes noise within a month.
A second common error is ignoring how each tool defines its data. Two systems may both report a figure called active users or open tickets while counting them differently. When those numbers sit side by side, managers assume they are comparable and draw wrong conclusions. During setup, document the definition behind each metric and note its source system and refresh time. Where definitions conflict, either reconcile them at the source or label them clearly on the dashboard so nobody mistakes one figure for another.
Many consolidations fail because access is handled after launch rather than during design. People see data they should not, or they cannot see data they need. Map roles to data before you build: who should view, who should edit, and who should export. Test with a small group representing each role, and check that filters respect permissions rather than merely hiding buttons. If your tools support single sign-on, connect it early. Permission problems are far cheaper to fix in a pilot than after the whole company depends on the dashboard.
Another mistake is connecting too many live feeds at once. Every live connection adds load, cost, and a new point of failure. Start with the two or three sources that matter most, run them for a full reporting cycle, and confirm the numbers match the source systems. Add further tools only after the first set is stable. Keep a simple log of each connection, its owner, and its refresh schedule. When a number looks wrong, that log tells you where to look first.
Finally, teams forget the human side. They launch without training, without a named owner, and without a way to request changes, so the dashboard drifts and people return to spreadsheets. Assign one owner accountable for accuracy and one channel for requests. Run a short walkthrough for each team, showing where their numbers come from and what to do when something looks off. Review usage monthly and retire panels nobody opens. If a metric keeps breaking and you cannot trace it, ask your vendor or consultant for help early.
Start with the decisions, not the tools. Write down the recurring decisions your teams make, such as approving purchases, staffing a shift, or following up on overdue invoices, and note what information each decision needs. This list becomes your specification. It tells you which tools must connect, which reports matter, and which can wait. Buyers who begin with a tool inventory often end up with a crowded screen; buyers who begin with decisions end up with a dashboard people open every morning.
Next, assess your data sources honestly. List every system that holds relevant records, then note for each whether it offers an API, a scheduled export, or only manual downloads. Manual sources are workable but need a clear owner and schedule, or they go stale. Check how often each source changes and set refresh expectations accordingly. A dashboard refreshing hourly on data that changes monthly wastes effort, while a daily refresh on fast-moving operational data may be too slow for the decisions it supports.
Consider who will maintain the setup after launch. A dashboard is a small product, not a one-time project. Decide whether maintenance sits with an internal analyst, your IT team, or an external partner, and confirm that person can access every connected system. Ask what happens when a source changes its export format or credentials expire. Document the answer. If you run a school or hospital, it is worth comparing options built for your sector, such as the best school management software india providers or the best hospital management software india vendors, and checking whether their dashboards match your reporting needs.
Set a realistic scope for the first version. Choose a pilot covering one team and a small number of sources, define what success looks like in plain terms, and agree a review date. Success might mean the weekly report is assembled automatically or that a manager stops asking for a manual export. Keep the pilot narrow enough to finish and broad enough to prove the approach. Expand only after the pilot survives a full cycle, including month-end or term-end, when data volumes and pressures peak.
Finally, weigh build versus buy against your capacity. Configuring an existing platform is usually faster, while custom work fits unusual workflows but needs ongoing development. For organisations running many connected systems, an erp software india platform with built-in reporting may reduce integration work, but confirm it covers your actual tools rather than forcing replacements. Ask each vendor to show a working dashboard with your kind of data, and request a written scope covering sources, refresh, access, and support before you commit.
How long does setup take? It depends on how many sources you connect and how clean their data is. A pilot with a few sources and a defined scope can often be running within a few weeks, while a company-wide rollout with many systems takes longer. Ask for a phased plan with checkpoints, and treat the first phase as a test rather than a deadline. The honest answer is that data quality work, not dashboard configuration, usually sets the pace, so plan for it explicitly in the schedule.
Will it replace our existing tools? No. One dashboard brings your tools and reports together; it does not necessarily retire the systems behind them. People still enter data where they work today, and the dashboard reads from those systems. Replacing tools is a separate decision with its own costs and risks. If a vendor promises to eliminate every system you own, ask which records would move, who would migrate them, and how historical data would be preserved before you accept that claim.
How do we know the numbers are correct? Correctness comes from traceable definitions and checks, not from the dashboard itself. For each metric, record the source system, the calculation, and the refresh time, then compare dashboard figures against source reports during the pilot. Assign someone to investigate mismatches. Where two systems disagree, decide which is authoritative. Build a small reconciliation check for your most important figures and review it regularly, especially after any change to a connected tool.
What about security and access? Ask where data is stored, how it travels between systems, and who can see what. Confirm that access follows roles, that leavers lose access promptly, and that exports are controlled. Request the vendor's security documentation and read it rather than skimming. If you operate in a regulated sector, check how the setup supports your record-keeping obligations. These questions are reasonable at any stage, and a vendor who cannot answer them clearly is telling you something useful.
What does support cover after launch? Get the answer in writing. Clarify who fixes a broken connection, how quickly, and at what cost; whether new reports are included or quoted separately; and how changes are requested. Ask what happens if a connected tool changes its interface. Confirm training is included for each team. Before signing, agree a short exit plan describing how you would retrieve your data and configurations if you later change providers, so you are never locked in.
One dashboard that brings your tools and reports together. That is the core of what you receive: a single view that pulls figures from the systems you already run and presents them in one place. The scope covers connecting agreed sources, defining the metrics shown, and laying out panels for the teams who need them. During discovery we list every source, confirm how each one can be read, and agree which reports appear on the first version. Nothing is connected without your sign-off.
Configuration includes the layout and the filters people use daily. We set up views by role, so a manager sees operational summaries while a finance user sees billing and outstanding items. Filters for date range, location, and department are configured against your actual data structure. We also set refresh schedules to match how often each source changes. Where a source needs a scheduled export, we document the owner and timing so the pipeline does not quietly stop when someone is on leave.
Access control and documentation are part of the package. We configure user roles, connect single sign-on where your systems support it, and test that each role sees only what it should. You receive written documentation covering each connected source, the definition of every metric, the refresh schedule, and the named owner for changes. A short training session walks each team through their view, including what to do when a figure looks wrong and who to contact for fixes.
We also include a pilot review before wider rollout. After the first version runs for a full reporting cycle, we compare dashboard figures against source reports, investigate mismatches, and adjust definitions or layouts based on what teams actually used. Panels nobody opened are removed or reworked. This review is where most of the practical value is captured, because it turns a technical setup into something your teams trust and rely on for their regular decisions.
Finally, the handover covers how to extend the dashboard later. You get a description of how new sources are added, what information we need to connect them, and how changes are requested and prioritised. This matters whether you run a growing business or a specialist operation, and it is the same discipline we apply to every engagement from our base in Uttarakhand, India. The aim is a setup you can operate and grow without starting over.
The dashboard does not fix the data in your source systems. If records are duplicated, incomplete, or entered inconsistently, the dashboard will display those problems faithfully. Cleaning source data is separate work with its own scope, and it usually needs involvement from the teams who own those systems. We will flag issues found during discovery and during the pilot review, but correcting them at source is agreed as a distinct piece of work rather than assumed as part of the dashboard build.
We do not replace the tools you use to run the business. Your accounting, scheduling, clinical, or academic systems remain the place where records are created and edited. The dashboard reads from them and presents summaries; it is not a substitute for those systems, and it does not migrate historical records between them. If you are considering replacing a core system, that is a separate project with its own planning, and we will say so rather than folding it into the dashboard scope.
Hardware, network upgrades, and third-party licence fees are outside the scope. If a source system requires a paid integration module or an upgraded plan to expose its data, that cost sits with you and the relevant vendor. Similarly, if your internet connection or local infrastructure cannot support the refresh schedule you want, that is a separate matter. We will identify these dependencies during discovery so they appear in your planning rather than surfacing unexpectedly midway through the build.
The dashboard does not make decisions for you. It presents figures, trends, and exceptions, but interpreting them and choosing a course of action stays with your team. We do not provide financial, legal, or clinical advice, and we do not guarantee particular business outcomes from using the dashboard. What we provide is accurate presentation of the data you hold, with clear definitions and traceable sources, so that the people accountable for decisions have reliable information in front of them.
Ongoing changes beyond the agreed support terms are not included by default. New reports, additional sources, and layout changes after handover are quoted or scheduled according to the support arrangement we agree. We will always tell you whether a request falls inside or outside that arrangement before starting. If something breaks and you cannot trace the cause, contact us early rather than working around it, because small connection problems are easier to resolve before teams start relying on workarounds.
Timelines depend on how many tools you connect and how clean their data is, so we start by mapping every source you use today. In a scoping session we list each system, note where its reports live, and agree which figures must appear on day one. From that list we build a simple sequence: connect the core tools first, then add secondary reports. You get a written plan with stages and checkpoints before any build begins, so everyone knows what happens in which week.
The first working version usually covers your most important data: sales, stock, invoices or job status. We connect those sources, confirm that totals match the reports you already trust, and show you a draft dashboard for review. Expect several rounds of small corrections here, because field names and date formats rarely line up first time. When you review, check that each number matches its source exactly. If a figure looks wrong, tell us before the next stage rather than after more tools are added.
Adding the remaining tools takes longer when a system has no clean export or uses custom fields. For those, we agree on an export method, test it with a sample, and only then schedule the full connection. If you run an erp system india team that already produces regular reports, share those files early so we can match their structure. Ask for a revised timeline as soon as a new tool is requested mid-project, since each addition changes the sequence and the testing effort.
Testing is a stage in its own right, not a formality. We compare dashboard totals against source reports for a full working period, check how the dashboard behaves at month-end, and confirm that access is limited to the right people. You should nominate one person to sign off each section. If a discrepancy appears, we trace it to the source field rather than adjusting the dashboard. Plan for this review time in your own calendar, because your feedback drives the final fixes.
Go-live is a short step once testing is signed off. We switch the dashboard on for the agreed group, keep the old reports available for a short overlap, and watch the first few days for errors. Ask for help immediately if a scheduled refresh fails or a total changes unexpectedly. After the overlap, you can retire duplicate spreadsheets. If your requirements grow later, we treat new tools as a fresh short cycle rather than reopening the original build.
Migration starts with an inventory. Gather every spreadsheet, exported report and system screen your team currently uses, and note who owns each one. We review the list together and mark each item as keep, merge or retire. This step prevents the common mistake of copying old reports into a new dashboard without asking whether anyone still needs them. Bring your accounting software india small business exports too, since finance figures often overlap with sales and stock data.
Next we agree on definitions. Two reports may use different names for the same thing, or the same name for different things. We write a short data dictionary covering each field, its source, and how it is calculated. Your team confirms the definitions before any connection is built. This is the point to raise disagreements between departments, because resolving them now is far easier than correcting a dashboard that everyone has already started trusting.
Connecting sources comes after definitions. Where a tool offers an API or scheduled export, we use it; where it does not, we agree on a manual export routine with a clear owner and frequency. Each connection is tested with a sample period and compared against the original report. Check that dates, currencies and tax fields map correctly. If a source system is being replaced soon, tell us before we build, so we do not spend effort connecting something that will disappear.
Clean-up is usually the longest part. Duplicate records, inconsistent customer names and missing fields all need decisions. We prepare a short list of issues for your team to resolve in the source systems rather than patching them inside the dashboard. Keep the original files archived, not deleted, until the new dashboard has run through at least one full reporting cycle. Ask for help if a source system cannot be corrected, and we will agree a practical workaround with you.
Finally, we document what was migrated. You receive a list of connected sources, the refresh schedule, and the owner for each report. We walk through the dashboard with the people who used the old files and confirm nothing essential is missing. After the first month, review the retired reports and confirm they can be archived. If a team member later needs an old report restored, the documentation shows exactly where it came from.
Training works best in small groups organised by what people actually do. We run separate sessions for sales, operations and finance, because each group reads different figures and asks different questions. Before each session, we prepare a short guide showing the screens that group will use most. Ask people to bring one real question they would normally answer with a spreadsheet. Answering those questions live during the session is the fastest way to build confidence in the dashboard.
Each session covers three things: finding a figure, checking where it comes from, and exporting or sharing it. We show how to filter by date and team, how to confirm a total against its source, and how to raise a query when something looks wrong. Nobody should be expected to memorise the layout. Instead, we make sure each person knows how to navigate to their own area and who to contact when a number does not match their expectation.
Write down the questions people ask during training and turn them into a short internal FAQ. This is more useful than a long manual nobody reads. Include common tasks such as pulling a monthly summary, comparing periods, and checking whether data has refreshed. Keep the FAQ in a shared location and add to it as new questions appear. If several people ask the same question, that usually signals a screen or label that needs clarifying rather than more training.
Give one or two people per team a deeper session so they can help colleagues day to day. These internal champions learn how to check refresh status, explain definitions and escalate genuine issues to us. They do not need to build anything; they need to answer routine questions quickly. Confirm who these people are before go-live, tell the wider team who they are, and make sure their names appear in the FAQ so nobody is unsure where to turn.
After two to four weeks, run a short review session. Ask what people still find slow or confusing, and note any reports they have quietly gone back to using. Those are the clearest signals of a gap. We fix labels, adjust layouts or add a missing view where needed. If new staff join later, the champion can run the introductory walkthrough using the same guide. Ask for help if turnover means several people need retraining at once.
Maintenance keeps the dashboard trustworthy. Each connected tool changes over time: fields are renamed, exports change format, and access permissions shift. We agree a simple routine that includes checking refresh status, confirming that totals still match source reports, and reviewing who has access. Assign one owner inside your company for this routine, even if we handle the technical work. Without a named owner, small failures go unnoticed until someone makes a decision on stale figures.
Data refreshes need watching, especially around month-end and busy periods. Agree how often each source should update and what happens if a refresh fails. We set up alerts where the tools allow it, and your owner checks the dashboard on agreed days. If a refresh has not run, the dashboard should say so clearly rather than showing old numbers without warning. Ask for help as soon as a refresh fails twice, because repeated failures usually point to a changed export or an expired connection.
Changes to your tools should be reported before they happen. If you upgrade a system, change a chart of accounts, or add a new branch, tell us so the connections and definitions can be reviewed. Small changes are quick to handle when reported early and slow to untangle when discovered later. Keep a short log of changes made to source systems, with dates, so any unexpected dashboard figure can be traced back to a cause.
Access reviews matter as much as technical checks. People change roles and leave, and dashboard access should follow. Review the user list at agreed intervals, remove access that is no longer needed, and confirm that sensitive finance views are limited to the right group. Record who approved each access change. If you use shared logins today, plan to move to individual accounts, because shared accounts make it impossible to tell who viewed or exported what.
We review the dashboard with you periodically to check it still matches how the business works. New questions appear, old reports become irrelevant, and layouts drift out of date. Bring a list of what your team asks for most often. We agree which changes are worth making and which can wait. Ask for help if a source system is being retired or replaced, since that usually requires a planned change rather than a quick fix.
Start by writing down the questions you want the dashboard to answer. Keep it short and practical: which figures you check daily, which you check monthly, and which reports you rebuild by hand today. This list becomes the basis for scoping. Bring it to a first conversation with us at AWEBCs in Uttarakhand, India, and we will tell you honestly which parts are straightforward and which need more work before a build can start.
Before that conversation, gather sample exports from your main tools. One recent month of data is usually enough to assess structure and quality. Note who currently owns each report and how often it is produced. If your team already maintains an erp system india setup, include its standard reports so we can see what is available without custom work. The clearer the samples, the more accurate our scoping and the fewer surprises later in the project.
The first meeting covers scope, sequence and responsibilities. We agree which tools connect first, who signs off each section, and what your team needs to prepare. You should leave with a written summary of what will be built and what is expected from your side. Nothing should be vague at this stage. If a requirement is unclear, we note it as an open question with an owner and a date rather than guessing at an answer.
Decide early who will own the dashboard internally and who will attend training. Confirm that the people who produce today's reports are involved, because they know where the data problems are. Agree a realistic start date that avoids your busiest period if possible. If you are comparing options, ask each supplier the same questions about connections, testing, documentation and ongoing support, so the answers can be compared fairly rather than on price alone.
To move forward, send us your question list and sample exports, and we will propose a scoping session. Keep the first phase small: connect the core tools, prove the figures match, and get the team using the dashboard before adding more. That approach reduces risk and gives you something useful early. Contact AWEBCs to book that first conversation and agree the practical steps that follow.
Questions
The price is based on the specific tools and reports you need to integrate into the single dashboard. Because every business has different systems, we provide a custom quote after understanding your requirements. There is no fixed price list; instead, we tailor the solution to your exact needs and the complexity of the integration.
Costs increase with the number of data sources, the complexity of custom reports, and any need for real-time data synchronization. If your tools require special connectors or extensive data transformation, that adds to the effort. The more tools and the more customized the reporting, the higher the overall cost.
We can arrange a demonstration of One Dashboard for Every Tool to show how it brings your tools and reports together. A free trial is not standard, but we can discuss a pilot arrangement based on your requirements. Contact us to schedule a demo and see the dashboard in action.
We do not use a one-size-fits-all subscription. Instead, we provide a custom quote that may include a one-time setup fee and an ongoing support fee. The ongoing fee depends on the level of support and maintenance you require. This means your payment covers only the essentials you require
The number of users can affect the cost because more users may require additional server resources or user licenses for certain integrated tools. However, One Dashboard for Every Tool is designed to be scalable, and we will discuss user tiers during the quoting process to find a cost-effective solution for your team size.
Yes, we provide free quotes. Simply contact us with your requirements, and we will assess the scope and provide a detailed quote. There is no obligation to purchase. This allows you to understand the potential investment before making a decision.
The initial setup cost covers requirements analysis, dashboard design, integration of your tools, and testing. It also includes training for your team. The exact scope depends on your specific tools and reporting needs, so we define it clearly in the quote.
No, we are transparent about all costs. Our quotes itemize every component, including setup, integration, and any ongoing support. We do not have hidden fees. Any additional work outside the agreed scope will be discussed and approved by you beforehand.
The complexity of your existing tools directly impacts the integration effort. Tools with well-documented APIs are easier and faster to integrate, while legacy or custom systems may require more development time. This is reflected in the quote, ensuring you pay for the actual work required.
After setup, you may incur costs for hosting, maintenance, and support. Hosting can be on your infrastructure or ours; if ours, there is a hosting fee. Maintenance covers updates and troubleshooting. Support is optional but recommended. We will outline these in your quote.
The price is not industry-specific; it is based on the tools and reports you need. However, clinics or schools may have specific software that requires custom integration, which can affect cost. We tailor the solution to your industry's requirements, and the quote reflects that.
While we cannot provide a direct comparison without knowing your requirements, One Dashboard for Every Tool is often more cost-effective than full-scale ERP systems because it focuses on unifying your existing tools rather than replacing them. We provide a custom quote so you can compare based on your specific needs.
Yes, we can integrate accounting software such as Tally or QuickBooks. Integration with accounting software is common and may affect the price based on the specific software and the data you want to display. We will include this in your custom quote.
Implementation time varies with complexity, typically a few weeks. Time itself does not directly affect cost; cost is based on effort. However, a longer timeline may incur additional project management or resource costs if scope changes. We provide a timeline and fixed quote upfront.
Yes, customization of reports and dashboards is part of the service and is included in the quote. The cost depends on the number and complexity of reports. We work with you to define the reports you need and provide a clear price for their development.
Basic training is included in the setup cost. We provide documentation and a training session to get your team started. If you require more extensive training or ongoing training for new staff, we can arrange that for an additional fee, which will be quoted separately.
We offer scalable solutions that start with essential integrations and grow with your business. Our pricing is modular, so you can control costs by choosing what you need. We also provide flexible payment terms to accommodate small business budgets, making One Dashboard for Every Tool accessible.
Hosting can be on your own servers or on ours. If you choose our hosting, there is a monthly hosting price in India that depends on the resources required. We will specify the hosting cost in your quote based on your expected usage and data volume.
Yes, we offer optional maintenance packages that cover updates, bug fixes, and support. These are priced separately and can be monthly or annual. Including a maintenance package adds to the total cost but ensures your dashboard remains reliable and up-to-date.
Building in-house requires hiring developers and ongoing salaries, which can be more expensive than our solution. One Dashboard for Every Tool provides a cost-effective alternative with expert integration and support. We can provide a quote that demonstrates the savings compared to in-house development.
Setup time depends on how many tools and reports you need connected. Because One Dashboard for Every Tool brings your existing systems together, the process starts with a discovery step to understand your current setup. AWEBCs then configures the connections and dashboards. Exact timelines are confirmed after this review, so no fixed duration is promised upfront.
The first step is a consultation with AWEBCs to review your current tools and reporting needs. This discovery session identifies which systems you want connected and what reports matter most. From there, the team outlines a setup plan tailored to your business. This ensures the dashboard is built around your actual workflows rather than a generic template.
One Dashboard for Every Tool is designed as a centralized web-based solution, so you access it through a browser without installing separate software on each computer. This simplifies setup and reduces IT overhead. AWEBCs will confirm any specific browser or device requirements during the initial consultation to ensure smooth access for your team.
Yes, the core purpose of One Dashboard for Every Tool is to bring your existing tools and reports together. During setup, AWEBCs reviews your current software stack and configures connections so data flows into a single dashboard. The exact integrations available depend on your tools, and this is assessed during the initial discovery phase.
Training is part of the setup process, and the time required depends on your team's familiarity with dashboards and the number of users. AWEBCs provides guidance to help staff understand the consolidated view. The training schedule is agreed during planning, so it fits around your operations without disrupting daily work.
Setup is tailored to each business because the tools and reports you use vary. AWEBCs does not offer a one-size-fits-all package. Instead, the team scopes the work after understanding your systems. This approach ensures you only pay for the connections and configuration you actually need, keeping the setup relevant and efficient.
Before setup, AWEBCs will guide you on what data sources to identify and how to grant access to your existing tools. You do not need to manually export or reformat data in advance. The team handles the technical connection work. Your main preparation is confirming which reports and metrics are most important for your business.
During discovery, AWEBCs reviews your current tools, reporting workflows, and key metrics. This session clarifies what you want to see in a single dashboard and identifies any technical considerations. The output is a setup plan that outlines the connections and configuration needed. This phase ensures the final dashboard matches your operational needs from day one.
One Dashboard for Every Tool is configured by AWEBCs as part of the service, because connecting multiple tools and reports requires technical setup. While the dashboard is designed for ease of use once live, the initial integration work is handled by the team. This ensures reliable data flow and reduces the risk of misconfigured connections.
The time to your first consolidated report depends on the number of tools being connected and the complexity of your data sources. After discovery and configuration, AWEBCs validates the connections before you go live. A realistic timeline is provided in your setup plan, so you know when to expect the first unified view.
AWEBCs plans the setup to minimize disruption. Most configuration work happens in the background, and your team continues using existing tools during the process. Training and handover are scheduled at convenient times. Because the dashboard consolidates data rather than replacing your core systems immediately, daily operations remain largely unaffected during setup.
AWEBCs provides support throughout the setup, from initial discovery to configuration and training. You have a point of contact for questions about connections, data sources, and dashboard layout. This guided approach helps resolve issues quickly and ensures the dashboard is ready for your team without prolonged delays or uncertainty.
Yes, setup is customized to your sector. For a clinic, the dashboard might consolidate patient and appointment tools; for a school, it could bring together student and administrative reports. AWEBCs tailors the connections and views during discovery, so the dashboard reflects the specific workflows of your clinic or school rather than a generic template.
The number of tools you can connect depends on your requirements and is determined during the discovery phase. One Dashboard for Every Tool is built to bring multiple tools and reports together, so there is no fixed limit stated upfront. AWEBCs will scope the connections based on your priorities and ensure the dashboard remains manageable.
Technical requirements are minimal because the dashboard is accessed via a web browser. You need a stable internet connection and access credentials for the tools you want to connect. AWEBCs reviews any specific requirements during the initial consultation. This keeps setup straightforward and avoids the need for additional hardware or complex installations.
AWEBCs follows secure practices when connecting your tools and configuring the dashboard. Access to data sources is managed carefully during setup, and the team works with you to understand any security policies your business follows. Specific security measures are discussed during discovery to align with your requirements and ensure a responsible setup process.
Yes, the dashboard is designed to accommodate additional tools as your business evolves. After the initial setup, you can discuss further connections with AWEBCs. The process for adding tools is scoped separately, but the underlying architecture supports expansion. This means your dashboard can grow with your needs without starting over from scratch.
For a small business, the timeline depends on how many tools and reports are involved. Setup begins with discovery, followed by configuration and training. AWEBCs provides a schedule after reviewing your systems. Because the dashboard is tailored, no universal timeline applies, but the process is structured to be efficient for small teams with limited IT resources.
AWEBCs provides guidance and documentation as part of the setup to help your team understand the dashboard and its connections. This may include instructions on accessing reports and managing user views. Clear documentation supports a smoother handover and reduces reliance on ongoing support for basic tasks after the dashboard goes live.
The setup starts with a detailed review of your reporting needs during discovery. AWEBCs then configures the dashboard to bring those specific reports together from your various tools. You have the opportunity to review the configuration before go-live, ensuring the final dashboard reflects the metrics and views that matter most to your business.
Yes, AWEBCs works with you to schedule setup activities, including training and handover, at times that suit your operations. While some configuration happens remotely, the key sessions are planned around your availability. This flexibility helps ensure your team can participate fully without disrupting customer service or daily workflows.
If a tool is not currently supported, AWEBCs will assess it during discovery. The team reviews the available connection methods and discusses options with you. Because the dashboard is built to bring tools together, the feasibility of connecting a specific system is evaluated case by case, and you are informed before any commitment.
User account setup is part of the configuration phase and depends on the number of users and their roles. AWEBCs creates accounts and assigns appropriate access during setup. The time required is included in the overall setup plan, and the team ensures each user can access the reports relevant to their responsibilities from the start.
AWEBCs provides a preparation checklist during the initial consultation. It typically includes listing your current tools, identifying key reports, and confirming who needs access. Following this checklist helps streamline the discovery and configuration phases. It ensures the setup team has the information needed to build a dashboard that fits your business from the outset.
If your requirements change during implementation, AWEBCs reviews the impact with you. Because setup is scoped after discovery, any significant changes are discussed and planned accordingly. The team aims to accommodate reasonable adjustments without derailing the timeline, keeping you informed at each step so the final dashboard still meets your needs.
The plan is built around a single dashboard that brings your tools and reports together, so your everyday systems and the reports they produce appear in one place. The exact mix depends on the tools your business already runs, which is why we map them with you before setup. Nothing is added to your stack that you do not already use.
The base package delivers the core idea of the product: one dashboard that brings your tools and reports together. For a small business this means your existing systems feed a shared view instead of separate logins and spreadsheets. AWEBCs, based in Uttarakhand, India, scopes the package around the tools you actually run today.
Yes, user accounts are part of getting your team onto the dashboard. Each person who needs to view or work with the consolidated reports receives a login, so the single dashboard is shared rather than held by one person. AWEBCs sets these accounts up during implementation and confirms who needs access before going live.
Connecting the systems you already use is central to the product, because one dashboard brings your tools and reports together. Accounting software is one of the tools we look at during discovery, alongside your other business systems. Whether a specific package is supported is confirmed with you before setup begins, so expectations are clear.
The product is designed to bring your tools and reports together, so reporting is the heart of what you receive. Your existing reports are surfaced in one dashboard rather than rebuilt by hand each month. AWEBCs reviews your reporting needs during discovery and confirms which reports the plan will consolidate for your team.
Training is treated as part of implementation, not an optional extra, because staff need to use the dashboard confidently from day one. The scope of training is agreed with you during planning, based on how many people need access and what they will do. AWEBCs confirms this before work starts.
If a tool you rely on is not currently supported, we discuss it during discovery rather than after you commit. The product promise is one dashboard that brings your tools and reports together, so gaps matter. AWEBCs reviews each unsupported tool with you and agrees how to handle it before the plan is finalised.
Yes, the dashboard is intended to grow with your business, since new tools appear over time. Adding a tool later follows the same connection process used at the start, so your consolidated view stays current. AWEBCs agrees the approach for future additions with you during the initial planning conversation.
The number of systems connected in the first phase is agreed with you during discovery, based on the tools your business runs. We prioritise the systems that matter most to your reporting so the first dashboard view is useful quickly. AWEBCs confirms the exact scope in writing before implementation starts.
Documentation is part of the handover, so you know what has been connected and how the dashboard is arranged. It helps your team understand the consolidated view and supports anyone who joins later. AWEBCs provides this as part of implementation and walks you through it before sign-off.
Support runs throughout setup, so you are not left alone between steps. AWEBCs stays in contact during discovery, connection and handover, answering questions as your tools are brought together into one dashboard. The level and channels of support are agreed with you at the start so you know who to reach.
Setup covers the work of bringing your tools and reports together into one dashboard for the first time, including discovery, connection and handover. Ongoing service covers what happens afterwards, such as support and changes. AWEBCs explains both parts clearly before you commit, so you understand what each covers.
Hosting is discussed with you as part of scoping the plan, because the dashboard has to run somewhere reliable for your team. AWEBCs, as an IT and web consultancy in Uttarakhand, India, explains what is included and what is arranged separately before you commit. Nothing about hosting is left ambiguous in the proposal.
For a clinic or school, the reports that appear are the ones your existing systems already produce, brought together in one dashboard. AWEBCs reviews your reporting needs during discovery and confirms which reports the plan consolidates. The aim is one dashboard that brings your tools and reports together, matched to how your organisation actually works.
Yes, the plan is scoped to the business in front of us, so a single-location business is not pushed into a package built for larger groups. AWEBCs reviews your tools and reporting needs, then proposes a scope that fits. The product is one dashboard that brings your tools and reports together, sized to your operation.
At the end of implementation you receive a working dashboard that brings your tools and reports together, plus documentation and a walkthrough for your team. User accounts are in place and the agreed reports are visible in the consolidated view. AWEBCs confirms completion against the scope agreed at the start.
Tailoring is discussed during discovery, because every business wants its reports arranged differently. AWEBCs reviews what your team needs to see and confirms how the dashboard will be arranged for you. The scope of any custom layout is agreed in writing before implementation, so there are no surprises later.
Access is set up around who needs to see what, so managers and other staff can have different views of the same consolidated dashboard. AWEBCs agrees the access list with you during implementation. This keeps reports visible to the right people while the dashboard still brings your tools and reports together in one place.
Data preparation is part of the conversation before setup, because messy source data weakens any consolidated view. AWEBCs reviews what your tools hold and agrees what needs tidying before connection. The plan then reflects that preparation work, so the dashboard you receive is built on data you can trust.
Yes, if your business runs several branches or departments, the plan can be scoped to bring their tools and reports together in one dashboard. AWEBCs reviews how each location or team works and confirms the scope during discovery. The structure of the consolidated view is agreed with you before implementation begins.
Your existing vendors supply the individual tools; AWEBCs builds the layer that brings them together, so you get one dashboard that brings your tools and reports together. We are an IT and web consultancy in Uttarakhand, India, working alongside your current software rather than replacing it. Scope is agreed with you before work starts.
Yes, discovery comes first, because the dashboard must match how your business actually reports. AWEBCs reviews your tools, your reports and your team's needs, then confirms the scope in writing. Only after that review does implementation begin, so the plan reflects your real requirements rather than assumptions.
Changes during implementation are handled openly: we review the new requirement against the agreed scope and confirm with you how it affects the plan. AWEBCs documents the decision so both sides know what is included. The aim is to keep the dashboard bringing your tools and reports together without confusion about scope.
Yes, the product is deliberately focused: one dashboard that brings your tools and reports together, rather than a full ERP replacement. If your need is consolidated reporting across the systems you already run, AWEBCs scopes the plan around that. We confirm what is included before you commit to anything.
Your business keeps ownership of its data and the tools it already runs; AWEBCs builds and hands over the dashboard layer that brings them together. Ownership and access are confirmed during handover, along with documentation. Any questions about data handling are answered before implementation starts.
The first step is a discovery conversation, included in the plan, where AWEBCs reviews the tools you use and the reports your team needs. From that review we agree the scope in writing, covering which systems are connected and which reports appear on the dashboard. Implementation begins only after that scope is confirmed.
Support for One Dashboard for Every Tool is provided by AWEBCs, an IT and web consultancy based in Uttarakhand, India. You can reach the team directly for help with the dashboard, connected tools, and reports. Support covers setup questions, troubleshooting, and guidance on using the dashboard. Contact details are shared when you engage with AWEBCs, so you know exactly who to reach.
Response times depend on the support channel you use and the nature of your query. AWEBCs aims to respond promptly during business hours, and urgent issues are prioritised. Because AWEBCs is a consultancy rather than a large call centre, you get direct access to the team working on your dashboard. Exact response times are confirmed when you discuss your support needs with them.
You contact AWEBCs directly, the IT and web consultancy that builds and supports One Dashboard for Every Tool. AWEBCs is located in Uttarakhand, India, and works with businesses across India. When you start working with them, you are given the contact details for the team handling your dashboard, so you are not passed between departments or left searching for the right person.
Yes, support is available throughout the setup of One Dashboard for Every Tool. AWEBCs works with you during implementation to connect your tools and reports, and you can raise questions or issues as they arise. This hands-on support helps ensure the dashboard is configured correctly for your business. The support arrangement is discussed and agreed before setup begins, so expectations are clear from the start.
After your dashboard goes live, AWEBCs continues to provide support for the dashboard and its connected tools. You can contact the team for help with issues, changes, or questions about your reports. Ongoing support arrangements are agreed with you, so you know what is covered and how to reach AWEBCs. This helps keep your dashboard running smoothly as your business needs evolve.
Support outside normal business hours depends on the arrangement you agree with AWEBCs. Because AWEBCs is a consultancy, support terms are discussed and set based on your needs. You should confirm the hours of support and the process for raising urgent issues before or during setup. This ensures you know exactly what to expect if a problem occurs outside standard working hours.
You raise a support request by contacting AWEBCs through the communication channel agreed with you, such as email or phone. AWEBCs shares the appropriate contact details when you engage with them. Describe the issue clearly and include relevant details about your dashboard or connected tools. This helps the team understand and address your request efficiently, whether it concerns setup, reports, or day-to-day use.
AWEBCs is a consultancy that works closely with each client, so you deal directly with the team responsible for your dashboard rather than a distant helpdesk. Whether a single dedicated contact is assigned depends on the arrangement you agree. You should discuss this with AWEBCs when planning your dashboard, so you know who to reach for support and how communication will work.
If a connected tool stops working, contact AWEBCs support as soon as possible. The team can help investigate whether the issue lies with the tool, the connection, or the dashboard itself. Provide details about what changed and when the problem started. AWEBCs will guide you on the next steps to restore the connection and keep your consolidated reports accurate and up to date.
AWEBCs provides support to help your staff use One Dashboard for Every Tool effectively. Training arrangements are discussed as part of your engagement, so you can agree what your team needs. Support covers how to access reports, understand the dashboard, and raise issues. This helps your staff become confident with the dashboard and get value from consolidated reporting across your tools.
You can contact AWEBCs through the contact details on their website or by reaching out directly to their office in Uttarakhand, India. AWEBCs is an IT and web consultancy that builds One Dashboard for Every Tool. Asking questions before buying helps you understand support, response times, and who will handle your account. The team can explain how support works for businesses in India.
To report a bug or error, contact AWEBCs support and describe what you observed, including the report or tool involved and any error messages. AWEBCs will investigate and advise on a fix or workaround. Clear details help the team resolve issues faster. The support process and contact method are confirmed with you so you know how to report problems once your dashboard is live.
AWEBCs support focuses on One Dashboard for Every Tool and how your connected tools and reports come together in it. If an issue relates to a third-party tool, AWEBCs can help identify the cause and guide you, but the vendor of that tool may need to resolve it. The scope of support is agreed with you, so you know what is covered and who to contact for each type of issue.
For urgent issues affecting daily reporting, contact AWEBCs support immediately using the agreed channel. The team will prioritise the problem and work with you to restore access to your consolidated reports. Because AWEBCs works directly with clients, urgent matters reach the people who know your dashboard. You should confirm the urgent-issue process with AWEBCs during setup so everyone knows what to do.
Yes, AWEBCs is a consultancy with a real team you can speak to about your dashboard. Support is handled by the people who work on One Dashboard for Every Tool, not an automated system alone. You can discuss issues, ask questions, and get guidance directly. The contact method and availability are shared with you, so you know how to reach a person when needed.
When contacting AWEBCs support, include a clear description of the issue, the tool or report affected, when the problem started, and any error messages you saw. Mention what you were trying to do at the time. This helps the team diagnose the problem quickly. Providing complete details reduces back-and-forth and helps AWEBCs resolve your support request more efficiently.
If you forget your login or have access problems, contact AWEBCs support using the agreed channel. The team can help restore access or guide you on resetting credentials, depending on how your dashboard is configured. Access issues are handled as part of support. You should keep the AWEBCs contact details handy so you can reach them quickly when access problems arise.
Yes, AWEBCs supports businesses where multiple staff members use One Dashboard for Every Tool. Support can cover access questions, report usage, and general help for your team. The support arrangement is agreed with you based on your organisation's needs. You can discuss how many users need help and how requests should be raised, so support runs smoothly across your team.
Support during public holidays or festivals depends on the arrangement agreed with AWEBCs. As a consultancy in India, AWEBCs observes local holidays, and support availability during those times should be confirmed in advance. You should discuss your business's critical periods with AWEBCs so any necessary cover can be planned. This helps avoid surprises when you need help most.
Yes, you can request changes to your dashboard by contacting AWEBCs support. Changes might include adding a report, adjusting a layout, or connecting another tool. AWEBCs will discuss what you need and how it can be delivered. Because AWEBCs is a consultancy, change requests are handled directly with the team, and you are told what is involved before work begins.
When you engage with AWEBCs, you are given the relevant contact details for the team handling your account. Billing and technical support may be handled by different people, and AWEBCs will clarify this for you. Asking during the setup or purchase stage ensures you know exactly who to contact for each type of query, avoiding confusion and delays when you need help.
AWEBCs provides support directly through its team, and any documentation or guidance available is shared with you as part of your engagement. Whether a self-service portal or knowledge base is offered should be confirmed with AWEBCs. Direct contact remains the primary way to get help, ensuring you reach the people who know your dashboard and its connected tools.
If a support issue is not resolved quickly, you can ask AWEBCs to escalate it. Because AWEBCs is a consultancy with direct client relationships, escalation reaches the team responsible for your dashboard. You should discuss the escalation process with AWEBCs when agreeing support terms, so you know the steps to take and who to contact if a problem persists.
Indeed, AWEBCs serves companies throughout India, not just in Uttarakhand. Support is provided remotely through agreed communication channels, so your location within India does not prevent you from getting help with One Dashboard for Every Tool. You can discuss your location and support needs with AWEBCs to confirm how communication and assistance will work for your business.
You can give feedback about support by contacting AWEBCs directly through the agreed channel. Feedback helps the team improve how it supports clients using One Dashboard for Every Tool. AWEBCs values direct communication with clients, so sharing your experience is welcomed. You can raise both positive feedback and concerns, and discuss how your support arrangement might be adjusted to serve you better.
One Dashboard for Every Tool brings your tools and reports together, and AWEBCs treats the data passing between those connected systems as sensitive business information. Access is limited to the people you authorise, and we discuss the security arrangements for your specific setup during discovery so you understand exactly how your information is handled before anything is connected.
If one of your connected tools becomes unavailable, the rest of your dashboard keeps working with the data it already holds. AWEBCs will help you identify the failing connection and restore the sync. Your original data stays inside the source tool, so nothing is lost from your accounting or management system while the link is repaired.
Yes. User accounts and staff logins are part of what you get with the dashboard, and access can be arranged so each person sees the reports relevant to their role. Managers can be given a broader view while other staff see only their own area. We agree the access structure with you during setup.
The plan covers hosting, so you do not need to arrange separate infrastructure. Your dashboard and its consolidated reports are hosted as part of the service AWEBCs provides. If you want to understand the hosting arrangement in more detail for your business, raise it during discovery and we will explain what applies to your setup.
AWEBCs discusses backup and recovery arrangements with you as part of planning your dashboard. Because One Dashboard for Every Tool brings your tools and reports together rather than replacing them, your source systems continue to hold their own records. We will explain how your consolidated reporting data is protected before implementation begins.
You own your business data, and the tools you connect remain yours. AWEBCs builds and hosts the dashboard that brings your tools and reports together, but the underlying records stay in your accounting, clinic or school systems. Ownership and access terms are agreed with you before the project starts.
One Dashboard for Every Tool is designed to bring your tools and reports together, which suits clinics that want billing, appointments and other operational information consolidated. AWEBCs reviews your reporting needs during discovery so the dashboard reflects how your clinic actually works. We do not claim to replace your clinical systems, only to consolidate their reporting.
Yes. If your school already runs separate systems for fees, attendance or academics, the dashboard can consolidate their reports into a single view. AWEBCs reviews which tools you use during discovery and confirms what can be connected. Your source systems continue to hold and protect their own records.
The dashboard can bring reports from multiple branches or departments into one consolidated view, provided the underlying tools can be connected. AWEBCs confirms this during discovery. Access can then be arranged so branch managers see their own area while senior staff see the combined picture.
Your existing vendors supply the accounting, clinic or school software that holds your records. AWEBCs, an IT and web consultancy in Uttarakhand, India, builds the dashboard layer that brings those tools and reports together. We are not replacing your vendors; we consolidate what they produce so you can see it in one place.
One Dashboard for Every Tool is built around bringing your tools and reports together, so growth is a conversation you have with AWEBCs rather than a hard stop. Because the dashboard is delivered as a consultancy service, you can discuss adding tools and reports as your needs expand, and AWEBCs will advise on what that means for your setup.
Growth usually means more tools, more reports and more people relying on one view. One Dashboard for Every Tool is designed to consolidate your tools and reports in one place, so as your operations expand you can raise the change with AWEBCs and discuss how the dashboard should evolve to match your new requirements.
AWEBCs does not publish fixed limits on reports, because every business consolidates a different mix of tools and reports. The practical scope is agreed with you during implementation, and if you later need more consolidated reporting you can discuss an extension with AWEBCs rather than being locked into a fixed ceiling.
When your team expands, the dashboard needs to reflect new roles and reporting needs. Because AWEBCs delivers One Dashboard for Every Tool as a consultancy engagement, you can raise the change with them and discuss what additional consolidation, reports or access your growing team requires, then agree how the upgrade is handled.
Yes. One Dashboard for Every Tool is about bringing your tools and reports together, and AWEBCs can discuss a starting scope that fits your current operations. As your business grows, you can return to AWEBCs to discuss extending the dashboard to cover additional tools and reports, so the platform grows with you.
AWEBCs does not publish a maximum user count, because the right scope depends on your business and how many people need consolidated reporting. During implementation you agree who needs access, and as your team grows you can discuss additional users and access needs with AWEBCs directly.
One Dashboard for Every Tool is built to bring your tools and reports together, so changes in your accounting stack are a natural part of growth. If you adopt a new accounting package, raise it with AWEBCs so they can review how it fits your dashboard and discuss what adjustment your setup needs.
The sensible approach is to agree a starting scope with AWEBCs that covers the tools and reports you rely on today, then revisit it as your business grows. Because the dashboard is delivered through a consultancy engagement, you can discuss expansion with AWEBCs when the need arises rather than paying upfront for capacity you may not use.
One Dashboard for Every Tool consolidates your tools and reports in one place, which is what multi-location businesses typically need. If you open new branches, discuss the change with AWEBCs so they can review how the additional locations and their tools fit into your consolidated dashboard view.
Requirements change as businesses grow, and AWEBCs handles that through its consultancy model. If your needs shift after go-live, raise the change with AWEBCs so they can review the impact on your consolidated tools and reports and agree how the dashboard should be adjusted to match.
AWEBCs does not publish a fixed number, because the starting scope is agreed with you based on the tools and reports your business depends on. During implementation you and AWEBCs decide what to consolidate first, and later additions can be discussed as your requirements grow.
The dashboard is delivered as an ongoing consultancy relationship with AWEBCs, not a one-off product drop. That means as your business grows and your tools change, you can raise new requirements with AWEBCs and discuss how One Dashboard for Every Tool should be extended to keep your reporting consolidated.
Yes. One Dashboard for Every Tool is about bringing your tools and reports together, and departments can be brought into that consolidated view as your business evolves. Discuss the sequence with AWEBCs so the rollout matches your priorities and does not disrupt daily operations.
Expansion is handled through the same consultancy relationship that delivered your dashboard. Contact AWEBCs with your new requirements, and they will review what additional tools and reports need to be consolidated and discuss the scope with you before any change is made.
The point of One Dashboard for Every Tool is that your tools and reports come together in one place rather than multiplying separate views. As you add tools, AWEBCs reviews how they fit your consolidated dashboard, so the growth is managed through the consultancy engagement rather than left to you alone.
A practical trigger is when staff are again juggling separate tools or reports that should sit in one view. At that point, speak to AWEBCs about extending One Dashboard for Every Tool, and they will review your current setup and discuss what additional consolidation would serve your business.
Yes. Many businesses start with the tools and reports they rely on most, then broaden the scope as they grow. AWEBCs can discuss a starting point for One Dashboard for Every Tool and later review an upgrade when your reporting needs expand, keeping the engagement aligned to your size.
Raise it with AWEBCs. Because One Dashboard for Every Tool is delivered as a consultancy service, new tools can be reviewed and discussed as part of your evolving setup. AWEBCs will assess how the tool fits your consolidated reporting and agree the next step with you.
The approach is to expand in line with actual need rather than upfront. Discuss your growth plans with AWEBCs so the scope of One Dashboard for Every Tool is reviewed when it genuinely changes, and the consolidated tools and reports you pay for continue to match what your business uses.
AWEBCs does not publish performance limits, so the right answer comes from reviewing your specific setup. If you plan to add users as your team grows, discuss it with AWEBCs in advance so they can review your consolidated tools and reports and advise on how the expansion should be handled.
One Dashboard for Every Tool consolidates your tools and reports, so a change in services usually means a change in what needs consolidating. Speak to AWEBCs about the shift, and they will review your requirements and discuss how the dashboard should be adjusted to reflect your new operations.
Contact AWEBCs with the change you need, whether that is additional tools, more consolidated reports or new users. They will review your current setup, discuss what the upgrade involves, and agree the scope with you before any work begins, so the expansion stays tied to real business need.
There is no fixed rule, but a sensible habit is to review your consolidated tools and reports whenever your operations change materially, such as new branches, new software or a larger team. Raise that review with AWEBCs so any adjustment to One Dashboard for Every Tool is planned rather than reactive.
Doubling in size usually means more tools, more reports and more people needing one view. Raise the change with AWEBCs so they can review your consolidated setup and discuss what extension One Dashboard for Every Tool needs, keeping the dashboard aligned to your larger operation.
Agree your starting scope with AWEBCs around the tools and reports you actually use today, and revisit it when your requirements genuinely change. Because the dashboard is delivered through a consultancy engagement, expansion is discussed when the need arises rather than assumed upfront.
Your existing vendors each show you one slice of the business, so you end up checking several systems to answer one question. AWEBCs builds one dashboard that brings your tools and reports together, giving you a single view across accounting, operations and reporting instead of scattered logins and disconnected screens.
Many ERP packages ask you to replace your current tools and adapt to their way of working. One Dashboard for Every Tool takes a different route: it brings your tools and reports together rather than forcing a migration. As an IT and web consultancy in Uttarakhand, India, AWEBCs focuses on consolidating what you already run.
Building in-house means hiring developers, maintaining integrations and absorbing every change yourself. With AWEBCs you get one dashboard that brings your tools and reports together, delivered by a consultancy that already does this work. That removes the burden of staffing and maintaining a custom build while still giving you a consolidated view.
Spreadsheets depend on someone exporting and merging data by hand, which is slow and error-prone. One Dashboard for Every Tool brings your tools and reports together automatically, so the numbers you review are drawn from the source systems. For a small business in India, that means less manual effort and faster answers.
A standalone clinic package covers clinical workflow but may not consolidate your billing, accounting or other systems. One Dashboard for Every Tool brings your tools and reports together in one place, so patient, billing and financial information can be reviewed together. AWEBCs builds the dashboard around the tools a clinic already uses.
Schools often run fee, attendance and academic records in different products, and staff reconcile them manually. One Dashboard for Every Tool brings your tools and reports together, so administrators see consolidated reporting from those systems in one view. AWEBCs, based in Uttarakhand, India, builds the dashboard around your existing school software.
Stacking reporting add-ons means each vendor charges separately and the views still do not connect. One Dashboard for Every Tool brings your tools and reports together under one consolidated layer, so you avoid paying for overlapping add-ons. AWEBCs delivers this as a single dashboard rather than a collection of disconnected plugins.
Large ERP companies typically sell full suites that replace your systems. If you mainly need reports consolidated, that is more than you require. AWEBCs offers One Dashboard for Every Tool, which brings your tools and reports together without a full replacement, and as a consultancy it works closely with businesses on a focused scope.
A freelancer may deliver a working dashboard but leave you without ongoing structure or a team behind it. AWEBCs is an IT and web consultancy in Uttarakhand, India, and One Dashboard for Every Tool brings your tools and reports together as a defined offering. You deal with a consultancy rather than a single individual.
Generic BI tools give you a blank canvas and expect you to model and connect everything yourself. One Dashboard for Every Tool brings your tools and reports together as a ready approach, with AWEBCs handling the consolidation work. That suits buyers who want a working dashboard rather than a self-service platform to configure from scratch.
Hospitals usually run separate systems for billing, records and administration, which makes consolidated reporting difficult. One Dashboard for Every Tool brings your tools and reports together, so management can review information from multiple systems in one place. AWEBCs builds the dashboard around the tools a hospital already operates.
Working across many logins means switching between systems, re-entering context and manually comparing figures. One Dashboard for Every Tool brings your tools and reports together, reducing that switching and giving a single consolidated view. For growing businesses in India, this is a simpler alternative to managing each tool separately.
Each vendor reports only on its own data, so no single vendor can show you the combined picture. One Dashboard for Every Tool brings your tools and reports together across vendors. AWEBCs sits above those systems rather than replacing them, which is why it complements your existing software instead of competing with it.
Manual exports depend on staff remembering to run them, and versions drift quickly. One Dashboard for Every Tool brings your tools and reports together so the consolidated view is maintained as part of your setup. AWEBCs, a consultancy in Uttarakhand, India, builds this around the systems you already use.
Accounting-only tools show financial data but miss operational systems such as attendance, inventory or service records. One Dashboard for Every Tool brings your tools and reports together, so financial and operational reporting sit side by side. That wider view is what distinguishes it from a single-purpose accounting report.
Separate reports per location make comparison slow and inconsistent. One Dashboard for Every Tool brings your tools and reports together, allowing branches or departments to be reviewed in one consolidated dashboard. AWEBCs builds this around the systems each location already runs, so you do not have to standardise software first.
It is an alternative approach. One Dashboard for Every Tool brings your tools and reports together rather than replacing the systems you rely on. That means you keep the software your staff already know, while AWEBCs adds a consolidated dashboard layer on top for reporting and visibility.
Compare scope and disruption. A full ERP system typically replaces multiple tools and changes daily workflows, while One Dashboard for Every Tool brings your tools and reports together without that replacement. AWEBCs focuses on consolidation, so buyers who want visibility without a full migration have a lighter option.
AWEBCs is an IT and web consultancy based in Uttarakhand, India, working with businesses on their systems and reporting. One Dashboard for Every Tool brings your tools and reports together, and being locally based means you can discuss requirements directly with the consultancy building your dashboard.
Too many tools means fragmented data and staff spending time moving between systems. One Dashboard for Every Tool brings your tools and reports together into one consolidated view, so routine reporting happens in a single place. AWEBCs builds this around your current stack rather than adding yet another system to learn.
A large ERP rollout is a major commitment in time and disruption. One Dashboard for Every Tool brings your tools and reports together now, giving consolidated visibility without waiting for a full replacement project. AWEBCs offers this as a focused alternative for businesses that need reporting clarity sooner.
Businesses that grow tool by tool often end up with overlapping systems and no combined view. One Dashboard for Every Tool brings your tools and reports together, turning that accumulated stack into one dashboard. AWEBCs works with the tools you have rather than asking you to undo years of software choices.
Templates give you a layout but not the work of connecting your actual systems. One Dashboard for Every Tool brings your tools and reports together as a delivered service from AWEBCs, an IT and web consultancy in Uttarakhand, India. You get a dashboard built around your tools rather than a blank template to wire up yourself.
Department summaries arrive in different formats and are already out of date by the time they are compiled. One Dashboard for Every Tool brings your tools and reports together so management reviews a consolidated view drawn from source systems. That reduces the reconciliation effort departments currently spend preparing summaries.
An all-in-one suite requires moving every process onto one vendor and retraining staff. One Dashboard for Every Tool brings your tools and reports together while leaving those tools in place. For buyers wary of a disruptive switch, AWEBCs offers consolidation as a lower-risk alternative to a full suite migration.
Small businesses often cannot justify large ERP projects but still need a combined view of their numbers. One Dashboard for Every Tool brings your tools and reports together, giving consolidated reporting without replacing existing software. AWEBCs, a consultancy in Uttarakhand, India, builds it around the tools a small business already runs.
The dashboard does not replace those tools; it brings their reports together in one place. Instead of logging into each system separately and comparing numbers by hand, your team sees consolidated reporting from one dashboard. AWEBCs builds it around the tools you already run, so your existing software keeps working while the reporting stops being scattered.
That manual exporting is exactly the problem a consolidated dashboard addresses. One Dashboard for Every Tool pulls reports from your connected systems into a single view, so staff are not copying figures between spreadsheets each week. AWEBCs, an IT and web consultancy in Rudrapur, Uttarakhand, sets this up around the tools your business already uses.
Yes. The purpose of One Dashboard for Every Tool is to bring your tools and reports together, so patient-related reporting and billing figures can be viewed in one place rather than checked system by system. AWEBCs works with clinics that are tired of reconciling separate software, and builds the consolidated view around the reports you actually need.
A consolidated dashboard removes the need to ask each department for a monthly summary. One Dashboard for Every Tool brings your tools and reports together, so fee and attendance reporting can be reviewed in one view. AWEBCs builds this for schools that already own separate systems and want management reporting without replacing them.
The dashboard is one place to look, not another tool to learn in depth. Staff continue using the systems they already know, while reporting is consolidated into a single dashboard. AWEBCs, based in Uttarakhand, India, builds the setup around your existing tools, which keeps disruption low and avoids adding a complicated new platform.
AWEBCs starts by understanding your reporting needs, because the dashboard is built around the reports you require rather than sold as a fixed product. You can raise questions with the team before buying, and the discussion covers which tools you use and what you want consolidated, so you can judge the fit first.
That pattern is common, and it is the reason One Dashboard for Every Tool exists. Rather than forcing you onto a single all-in-one suite, AWEBCs connects the tools you already have and consolidates their reporting. The starting point is a conversation about your current systems and the reports you want to see together.
Vendor reports usually cover only that vendor's data, which leaves you comparing figures across systems yourself. AWEBCs takes a different approach by bringing your tools and reports together in one dashboard, so you see the combined picture rather than several partial ones. It works alongside your vendors instead of replacing them.
No. It is a dashboard that brings your tools and reports together, so your accounting software stays in place and keeps doing its job. AWEBCs builds the consolidated reporting layer on top, which means you gain a combined view without migrating your books to a new platform or retraining staff on unfamiliar accounting functions.
AWEBCs positions the dashboard as an alternative approach for businesses that need consolidated reporting rather than a full ERP implementation. One Dashboard for Every Tool brings your existing tools and reports together, which lets you address the reporting problem without committing to a broad ERP replacement across the whole organisation.
AWEBCs is an IT and web consultancy in Uttarakhand, India, focused on bringing your tools and reports together in one dashboard. Large ERP vendors typically sell a full platform and expect you to move onto it. If your need is consolidated reporting across the software you already run, that is a narrower and more direct problem to solve.
AWEBCs is a consultancy with a defined location and an ongoing relationship, not a single individual working alone. The work centres on one dashboard that brings your tools and reports together, with support available after delivery. That structure matters when you need continuity for a system your business depends on for reporting.
A template asks you to adapt your reporting to its structure. AWEBCs instead builds One Dashboard for Every Tool around the tools you use and the reports you need, so the dashboard reflects your business rather than a generic layout. The consultancy, based in Uttarakhand, India, works with you on what should appear in the consolidated view.
Compare scope. A full ERP typically replaces multiple systems and changes how staff work day to day. One Dashboard for Every Tool instead brings your tools and reports together, leaving existing software in place. If your core problem is scattered reporting rather than fragmented processes, the dashboard addresses that directly without a full ERP rollout.
Manual summaries depend on each department preparing figures separately, which is where inconsistencies creep in. A consolidated dashboard draws reporting from the connected tools themselves, so management reviews one view rather than reconciled emails. AWEBCs builds this around the systems your departments already use, without asking them to change tools.
AWEBCs is an IT and web consultancy located in Uttarakhand, India, so a business in the region can deal with a team it can reach directly. The dashboard itself brings your tools and reports together regardless of where your branches sit, and support continues after the setup is complete.
It reduces the number of places management needs to check. One Dashboard for Every Tool brings your tools and reports together, so instead of opening several systems to assemble a picture, you review the consolidated dashboard. Staff keep their existing logins for their own work, while reporting is gathered in one view.
Yes. AWEBCs offers this dashboard for businesses that want their reporting consolidated across the tools they already use, rather than a complete ERP replacement. One Dashboard for Every Tool brings your tools and reports together, which suits a small business that needs a clear combined view without overhauling its existing software.
A monthly summary arrives after the fact and depends on someone compiling it by hand. A consolidated dashboard draws on the connected tools directly, so the combined view is available without waiting for departmental write-ups. AWEBCs builds this around your existing systems, which keeps the reporting current rather than retrospective.
Your vendors supply their own tools and their own reports. AWEBCs supplies the consolidated layer: one dashboard that brings your tools and reports together across those vendors. That means a single view for management, built by a consultancy in Uttarakhand, India, rather than another standalone product with its own separate reporting.
A consolidated dashboard is designed for exactly that situation. One Dashboard for Every Tool brings your tools and reports together, so reporting from multiple locations can be reviewed in one view instead of branch by branch. AWEBCs builds the setup around the systems each location already uses, without forcing a change of software.
Building in-house means committing your own developers to design, integration and upkeep. AWEBCs delivers One Dashboard for Every Tool as a consultancy service, bringing your tools and reports together and supporting it afterwards. For a business without a development team, that avoids pulling staff away from their core work.
A standalone package usually covers clinical and administrative functions within one product. If your hospital already runs several systems and the difficulty is consolidated reporting, AWEBCs offers a dashboard that brings your tools and reports together instead. The two approaches answer different problems, and the dashboard does not require replacing existing software.
That is a reasonable starting point. The dashboard is built around the reports you need, so AWEBCs can focus on bringing those few together rather than pushing a broad platform. One Dashboard for Every Tool exists to consolidate reporting across your tools, and the scope follows what your business actually requires.
The dashboard is built around connecting tools and consolidating their reports, so it is intended to work with the systems you run rather than a single fixed product. As your business adopts new tools, AWEBCs can discuss extending the setup. The consultancy relationship continues after delivery, which matters when your toolset changes over time.
After the first year, we review your dashboard usage and connected tools with you to plan the renewal. We discuss any changes in your needs and adjust the renewal scope accordingly. You will receive a clear renewal proposal before the term ends, so you can decide without pressure. This ensures your dashboard continues to support your business without unexpected gaps.
After-sale maintenance includes monitoring connected tools, applying updates, and fixing any issues that arise with the dashboard. We provide support to ensure your reports stay accurate and your integrations remain functional. Maintenance is scheduled to minimize disruption to your daily operations. You can report problems through our support channels, and we will address them promptly.
Renewal terms are flexible and can be discussed based on your business needs. We understand that different businesses have different budgeting cycles, so we are open to shorter or longer renewal periods. Contact us to discuss a renewal term that works for you, and we will provide a clear proposal outlining the scope and any associated costs.
If you choose not to renew, we will work with you to ensure a smooth transition. You will retain access to your data, and we can provide export options for your reports. We will also discuss any outstanding support or maintenance issues before the term ends. Our goal is to make the offboarding process clear and hassle-free for your team.
We do not impose penalties for late renewal. However, to ensure uninterrupted service, we recommend renewing before the term expires. If your renewal is delayed, your dashboard may be temporarily suspended until the renewal is processed. We will remind you in advance and help you complete the renewal quickly to avoid any disruption to your reporting.
After renewal, you can request maintenance or support through the same channels as during the initial term. Simply contact our support team with details of the issue, and we will prioritize a resolution. We track all requests to ensure timely follow-up. Your renewal includes continued access to our support and maintenance services as outlined in your agreement.
Ongoing maintenance includes regular checks of your connected tools, updates to the dashboard software, and troubleshooting for any integration issues. We also provide support for user access problems and ensure your reports continue to reflect accurate data. The service is designed to keep your dashboard running smoothly so you can focus on your business.
Maintenance updates are performed as needed, based on tool changes, software improvements, or issues reported by users. We schedule updates to minimize disruption and inform you in advance when possible. Our team monitors the dashboard proactively to identify potential problems before they affect your reporting, ensuring a stable and reliable experience.
Yes, maintenance packages can be tailored to your business size and the complexity of your connected tools. We discuss your specific needs during the renewal process and propose a package that covers the right level of support. This ensures you receive appropriate maintenance without paying for services you do not require.
If a connected tool stops syncing, you can contact our support team for assistance. We will diagnose the issue, which may involve checking the tool's API or your credentials, and work to restore the connection. Our maintenance service includes troubleshooting for such sync problems, helping you get your reports back on track quickly.
Security is an ongoing priority. After setup, we apply security patches, monitor for vulnerabilities, and follow best practices to protect your data. Access controls are reviewed during maintenance to ensure only authorized users can view sensitive reports. We also provide guidance on secure password practices and help you manage user permissions as your team changes.
We typically send a renewal reminder well before your term ends, giving you ample time to decide. The notice period is designed to be convenient and can be discussed during your contract. We will contact you via email or phone to outline the renewal terms and answer any questions, ensuring you are never caught off guard.
Yes, you can upgrade your maintenance plan mid-term if your needs change, such as adding more tools or users. We will prorate the difference and adjust your service accordingly. Contact us to discuss your requirements, and we will provide a revised agreement that reflects the upgraded support level without disrupting your ongoing use.
We offer flexible payment options for renewal, including the possibility of installments. The specific terms depend on your renewal package and can be discussed with our team. We aim to make the renewal process convenient for your cash flow, so please reach out to explore the options available to you.
Our support team observes public holidays, but we have a process for urgent issues that affect critical reporting. You can report such issues through our emergency contact, and we will respond as soon as possible. For non-urgent requests, we will address them on the next business day. We will inform you of holiday schedules in advance.
If a renewal payment is missed, we will notify you and provide a grace period to complete the payment. During this time, your dashboard remains accessible. If payment is not received within the grace period, service may be suspended until the renewal is processed. We will work with you to resolve any payment issues promptly.
Multi-year renewals can be discussed, and we are open to offering favorable terms for longer commitments. The specifics depend on the length of the renewal and the scope of your dashboard. Contact us to explore options that suit your budget and planning horizon, and we will provide a tailored proposal.
We welcome feedback on our maintenance service. You can share your thoughts by contacting our support team or your account manager. We use this feedback to improve our services and address any concerns. Your input helps us ensure that our after-sale maintenance and renewal process meets your expectations and supports your business effectively.
Send your requirements and get a plan, timeline and quote from AWEBCs in India.
